2022 Point-in-Time Count Results
HSH conducted the 2022 PIT Count on February 23, 2022. We released preliminary data from the 2022 Point-in-Time Count in May. In August, our consultant Applied Survey Research published a report with in-depth information about the results of the count, including geographic breakdowns, demographic information, survey findings, and a supplemental youth report. This webpage summarizes key findings.
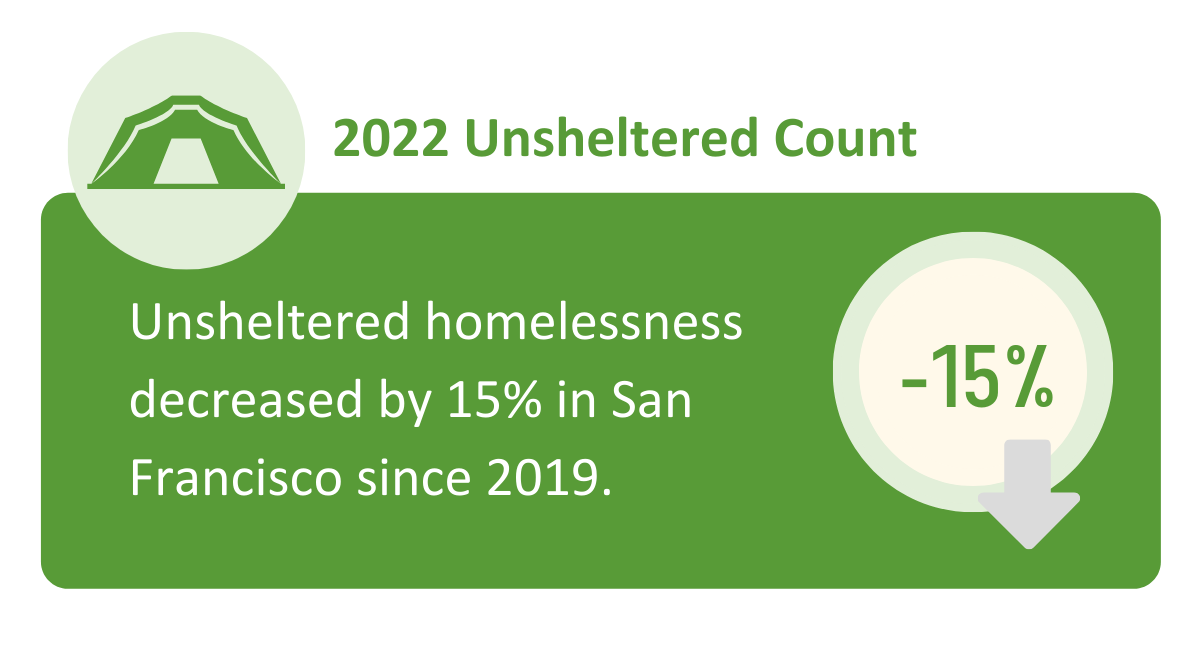
Since the 2019 PIT Count, unsheltered homelessness decreased in San Francisco by 15%. In 2019, there were 5,180 unsheltered people experiencing homelessness. In 2022, this number dropped to 4,397. This decrease corresponds with a significant increase in housing and shelter resources.
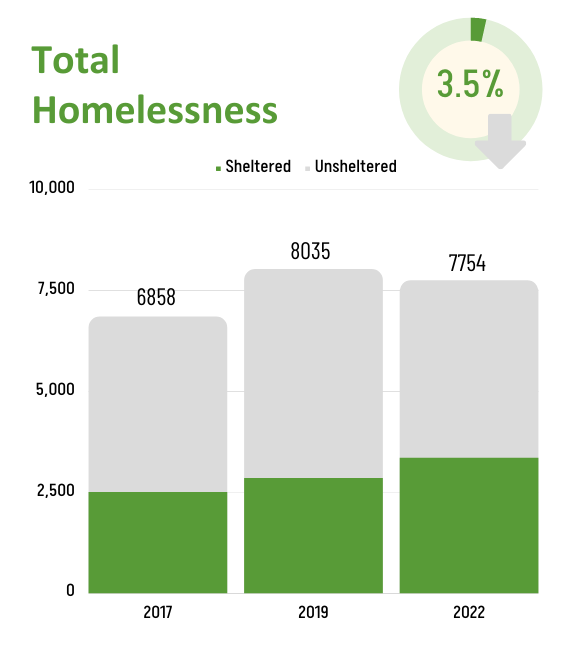
Total homelessness (combining sheltered and unsheltered people) decreased by 3.5% since 2019, dropping from 8,035 to 7,754 people.
This drop also represents a 9% reduction in homeless households (meaning both adult couples and families with children).
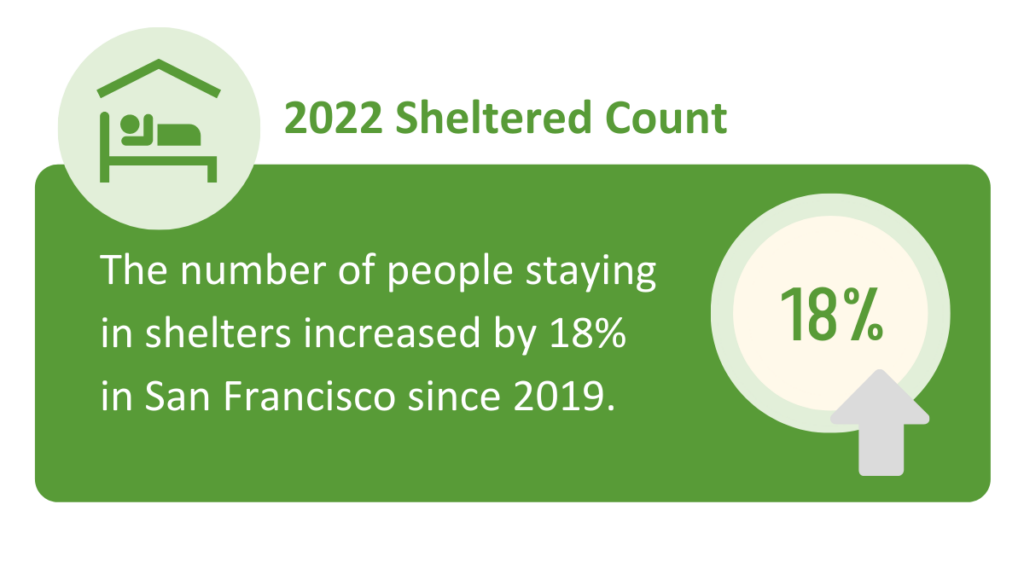
In 2022, 3,357 people were staying in shelters. This number is an 18% increase from the 2,855 people staying in shelters in 2019.
This rise corresponds with a 24% increase in available shelter beds. Learn more about HSH’s shelter inventory.
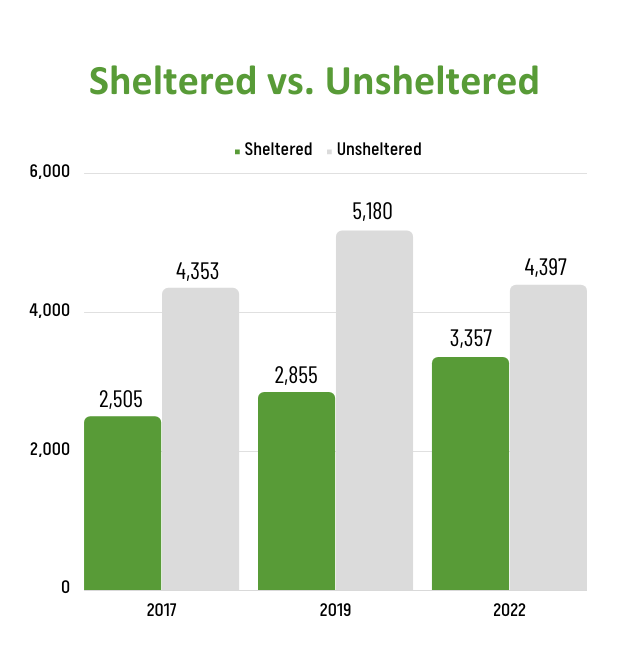
Unhoused people were more likely to be sheltered in 2022. 43 percent of the homeless population was sheltered in 2022, compared to 36% in 2019.
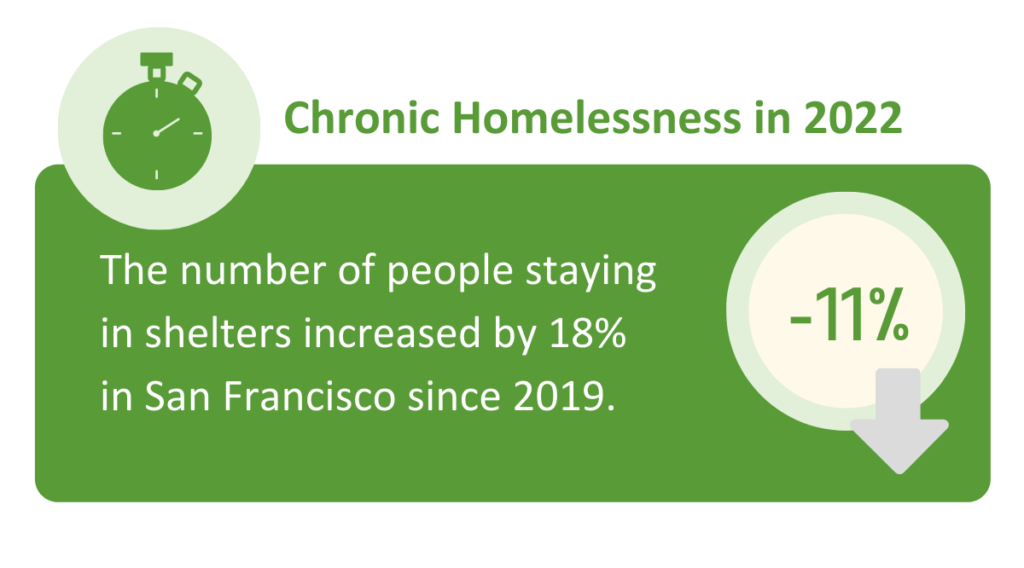
There were 2,691 chronically homeless people in 2022 compared to 3,030 in 2019. This represents an 11 percent decrease in chronic homelessness.
Demographics

- The share of Hispanix/Latinx people experiencing homelessness increased from 19% to 30% since 2019 PIT Count (a 55% increase), even as the total count of people experiencing homelessness dropped by 3.5%.
- This figure reflects overrepresentation in the homeless population, since Hispanic/Latinx people make up 16% of San Francisco’s general population.
- Black, African American, or African unhoused people are overrepresented at 38% of the total homeless population compared to 6% of the general population.
- Asians or Asian Americans are underrepresented at 6% of the homeless population compared to 37% of the general population.
- White people are also underrepresented.


Survey respondents were more likely to be under age 50 relative to previous years. This shift likely reflects recent years’ emphasis on sheltering and housing older adults vulnerable to COVID-19 (for example, the Shelter-in-Place hotel program).
- 28 percent of respondents are LGBTQ+.
- The transgender and gender non-conforming homeless population decreased by 20%, from 383 people in 2019 to 303 in 2022.

Subpopulation Data
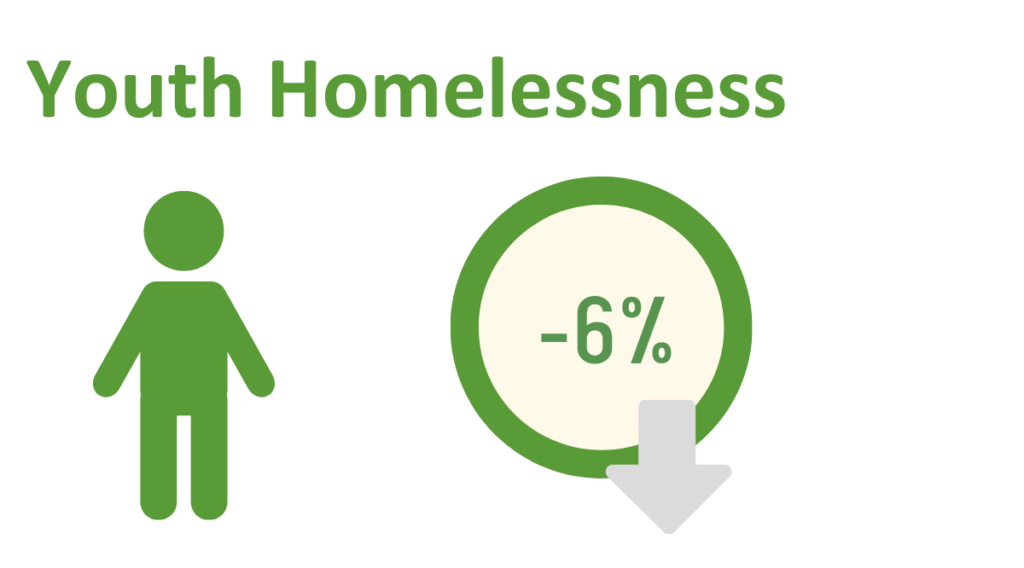
- Homelessness among youth under 24 decreased by 6% from 2019 to 2022, from 1,145 to 1,073 people.
- Parenting youth households experiencing homelessness decreased by 47%, from 36 to 19 households.
- 38 percent of unaccompanied youth under the age of 25 are LGBTQ+, in comparison to 28% of the adult population.
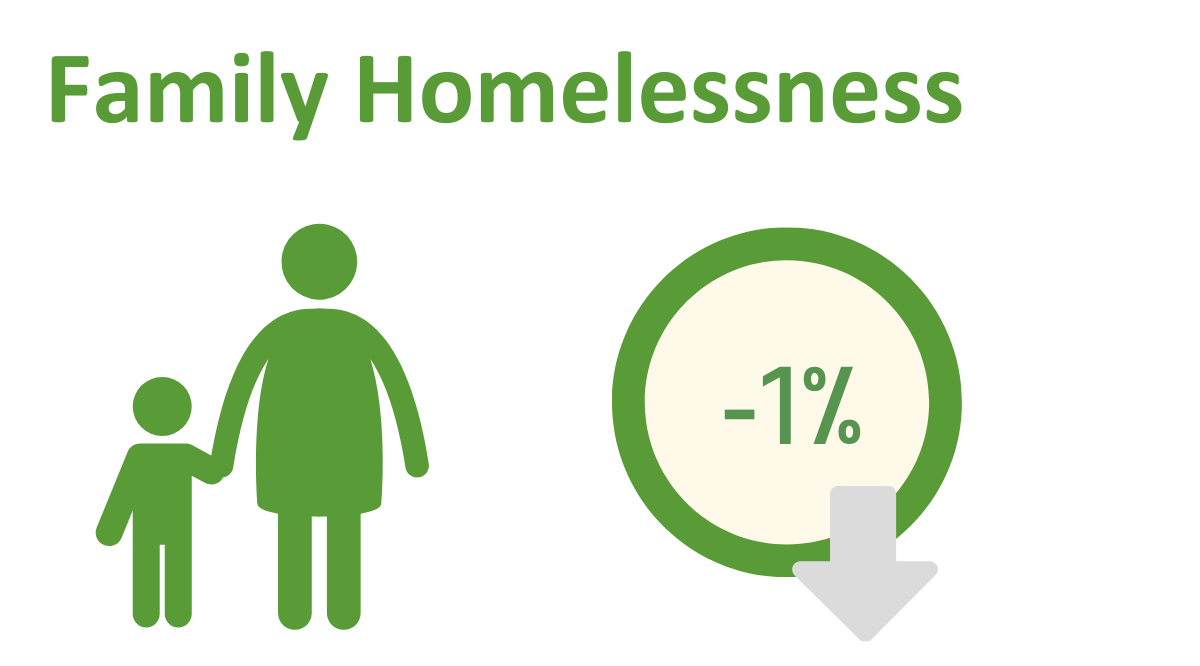
- Unhoused families decreased 1% from 2019 to 2022, from 208 to 205 households.
- This decline occurred despite new efforts in 2022 to identify unhoused families.

- The number of unhoused veterans remained flat, with 608 in 2019 and 605 in 2022.
- Veterans were more likely to be sheltered in 2022: 19 percent of veterans were sheltered in 2019 and 33% were sheltered in 2022.
Geographic Breakdown
Homelessness decreased in District 1, 8, 10, and 11; increased in Districts 3, 4, 5, and 6; and remained relatively flat in Districts 2, 7, and 9.
These figures are based on the district boundaries established in 2012, which were in effect the night of the Point-in-Time Count.


Key Survey Findings
- 71 percent of respondents reported living in San Francisco when they became homeless.
- 35 percent had lived in San Francisco for at least 10 years when they became homeless.

Fewer homeless respondents reported having a disabling condition: 39% in 2022 compared to 69% in 2019).


- Survey respondents were less likely to be accessing benefits in 2022, with 63% receiving government assistance compared to 73% in 2019.
- 56% of people not accessing benefits said they did not want government assistance, an increase from 30% in 2019
- Duration: 59 percent of respondents have been homeless for one year or more in 2022; a reduction from 65% in 2019
- Recurrence: Respondents are less likely to be homeless for the first time, at a rate of 23% in 2022 compared to 31% in 2019
- Substance use: The number of people reporting alcohol and drug use increased from 42% (2019) to 52% (2022).
- Justice involvement: Twenty-three percent of survey respondents reported spending at least one night in jail or prison within the previous 12 months, compared to 25% in 2019.
About the 2022 PIT Count
Full PIT Counts typically take place in odd-numbered years during the last week of January. San Francisco’s last full PIT Count took place in 2019. In 2021, HUD approved a waiver exempting San Francisco from conducting the unsheltered component of the 2021 PIT Count due to the COVID-19 pandemic. HSH still conduct the sheltered component of the 2021 PIT Count in line with HUD requirements.
In 2022, due to the impact of the omicron COVID-19 surge, San Francisco requested approval from the U.S. Department of Housing and Urban Development to postpone the 2022 Point-in-Time (PIT) Count from late January to Wednesday, February 23, 2022. With this decision, San Francisco joined other Bay Area agencies in requesting a postponement to support a safe and successful count. Despite the delayed count, results were available during the summer of 2022 on a timeline similar to the original schedule.
To conduct the 2022 PIT Count, outreach workers and volunteers walked or drove routes covering the entire geography of San Francisco to count people experiencing homelessness the night of February 23, 2022. The City also collected information from all emergency shelters and transitional housing sites.

The PIT Count is a one-night snapshot of homelessness in San Francisco. HSH estimates that as many as 20,000 individuals may experience homelessness in San Francisco over the course of a full year.
Analysis of these figures suggest that for every household San Francisco is able to permanently house through its Homelessness Response System, approximately four households become homeless. When the need exceeds available local resources, households unable to resolve homelessness on their own may need to leave San Francisco or remain homeless for long periods of time.
HSH leverages the Point-in-Time Count, along with other analysis, for strategic planning and program design. The PIT Count impacts funding and helps improves our understanding of the size and characteristics of our homeless population.